PlantCARE,是一个强大的植物顺式作用元件分析的网站,可用于查找启动子序列中的转录因子结合位点等重要调控元件。PlantCARE进行启动子顺式作用元件分析的原理就是基于PlantCARE数据库里面的很多个物种已知的顺式作用元件的序列去查找自己目的基因的启动子上的序列,因此PlantCARE放回的结果往往非常的多,因此分析PlantCARE里面的结果具有一定的难度。为此写了一个可以统计不同元件个数并进行可视化的脚本供大家使用。
1.启动子序列的上传
1.1 PlantCARE(https://bioinformatics.psb.ugent.be/webtools/plantcare/html/)首页的打开,然后点击“Search for CARE”。

1.2输入最后放回的结果的邮箱,返回结果的文件名称以及自己目的基因的启动子序列(FASTA格式),最后点击“Search”,约等待20分钟左右,结果文件会发到自己的邮箱里面。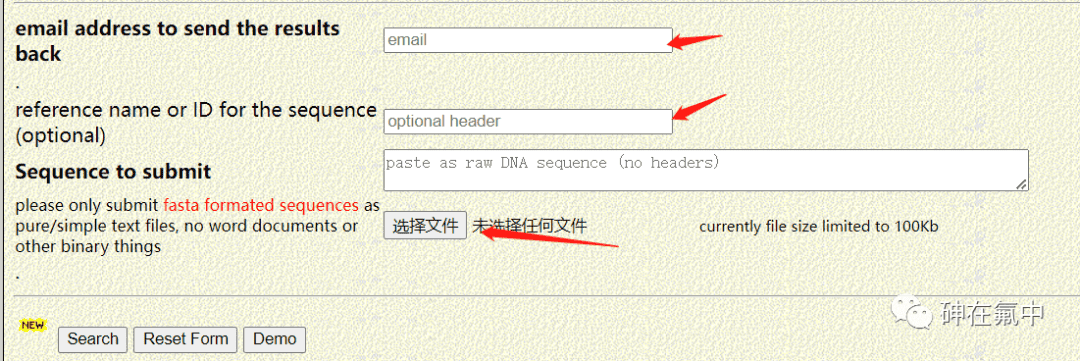
2.PlantCARE返回结果的统计
2.1 TAB文件的解读
在返回的压缩文件中,有一个TAB文件,里面存储了所有目的基因中预测到的顺式作用元件的信息,可以用记事本或者excel打开。TAB文件里面第一列为基因ID, 第二列为顺式作用元件的名称,第三列为元件的序列,第四列为元件在启动子上的起始位置,第五列为元件的长度,第六列为正负链信息,第七列物种的信息。
 为PlantCARE的结果文件添加列名,然后另存为“Plantcare_result.xlsx”文件。
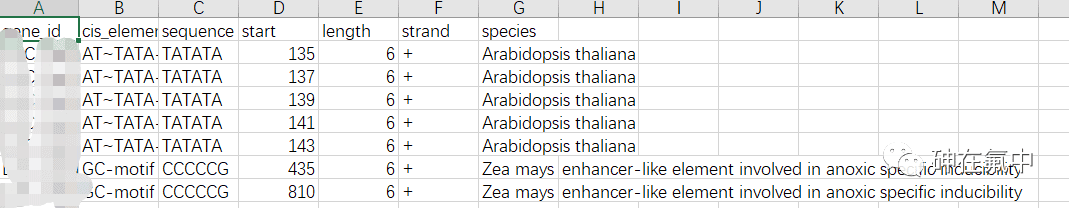
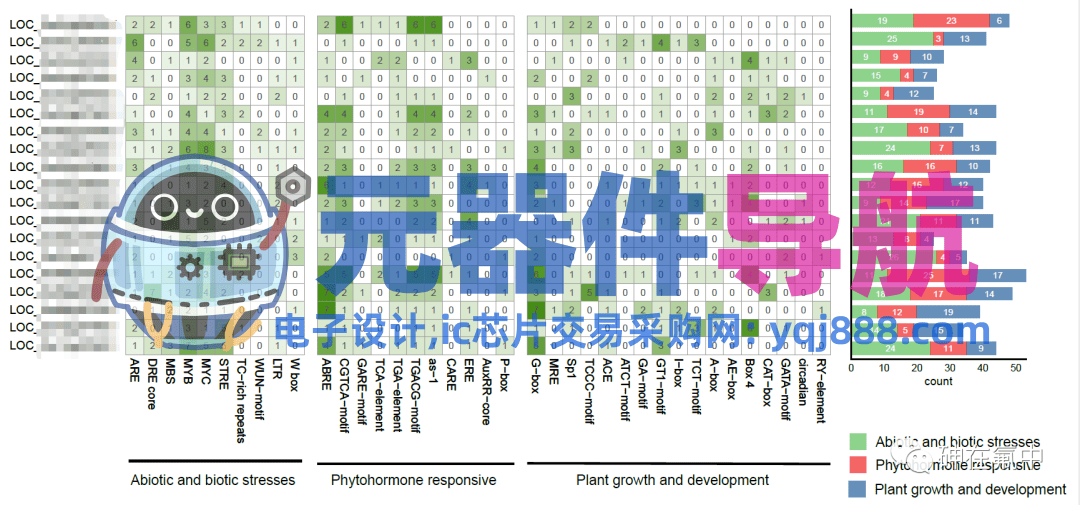
2.2 各个顺式作用元件的分类。
为了判断各个元件是在Abiotic and biotic stresses,Phytohormone responsive还是Plant growth and development有关,一篇Planta的文章中对一些顺式作用元件进行了分类[1]。我已经把文章中的结果整理在了cis_promoter.xlsx的文件中,大家在文章的最后附件那块下载即可。
2.3 读取和整理数据
在整理数据时,一般会过滤掉基本的启动区元件(TATA-box)和增加子元件(CAAT-box)等一些在所有基因都有的元件。
#======================堆叠柱形图的数据整理====================

#得到gene_id的因子,使得柱形图与热图的基因顺序一致
factor_levels <- group_by(cutin_cir, gene_id, category) %>%
  summarise(count = n()) %>%
  filter(category %in% "Abiotic and biotic stresses") %>%
  mutate(gene_id = factor(gene_id, levels = rev(gene_id)))
factor_levels <- levels(factor_levels$gene_id)

#整理绘图时的柱形图数据
stat_bar <- group_by(cutin_cir, gene_id, category) %>%
  summarise(count = n()) %>%
  mutate(cum_count = cumsum(count)) %>%
  mutate(position_x = cum_count-0.5*count) %>%
  mutate(gene_id = factor(gene_id, levels = rev(factor_levels))) %>%
  mutate(category = factor(category, levels = c('Plant growth and development',
                                                'Phytohormone responsive',
                                                'Abiotic and biotic stresses')))

#============================绘制堆叠柱形图======================
pdf('./stat_bar.pdf', width = 3.2, height = 7)
p <- ggplot(data = stat_bar, aes(x = count, y = gene_id)) +
  geom_col(aes(fill = category), position = 'stack', width = 0.7, alpha = 0.6)+
  geom_text(color = 'white',
            aes(x = position_x, y = gene_id, label = count)) +
  scale_fill_lancet() +
  scale_x_continuous(expand = c(0,0))+
  #使柱子从0的位置开始
  theme_half_open()+
  theme(legend.position = 'top',
        axis.text.y = element_blank(),
        axis.ticks=element_blank())+labs(y = NULL)

print(p)
dev.off()
2.5 AI绘图整理
参考文献
[1] Mengarelli DA, Zanor MI (2021) Genome-wide characterization and analysis of the CCT motif family genes in soybean (Glycine max). Planta 253 (1):15. doi:10.1007/s00425-020-03537-5
附件
链接: https://pan.baidu.com/s/1ZY7RF5XSZo2iCQOl4gVSuw
提取码: kxhn
本篇文章来源于微信公众号: 砷在氟中 喜欢可以搜索关注!